

Release 1: Chart
A Steps button and text field has been added to the toolbar which allows the user to display the chart in period steps to show how the project progresses through time. See the Steps page for more detail.
The
Layout Designer and
Title Block Designer have been combined into a single utility and are now only accessible from the
Chart window toolbar.
A Save button has been added to the toolbar which allows the user to save the Chart graphic as a BMP , JPG, PDF or PNG file.
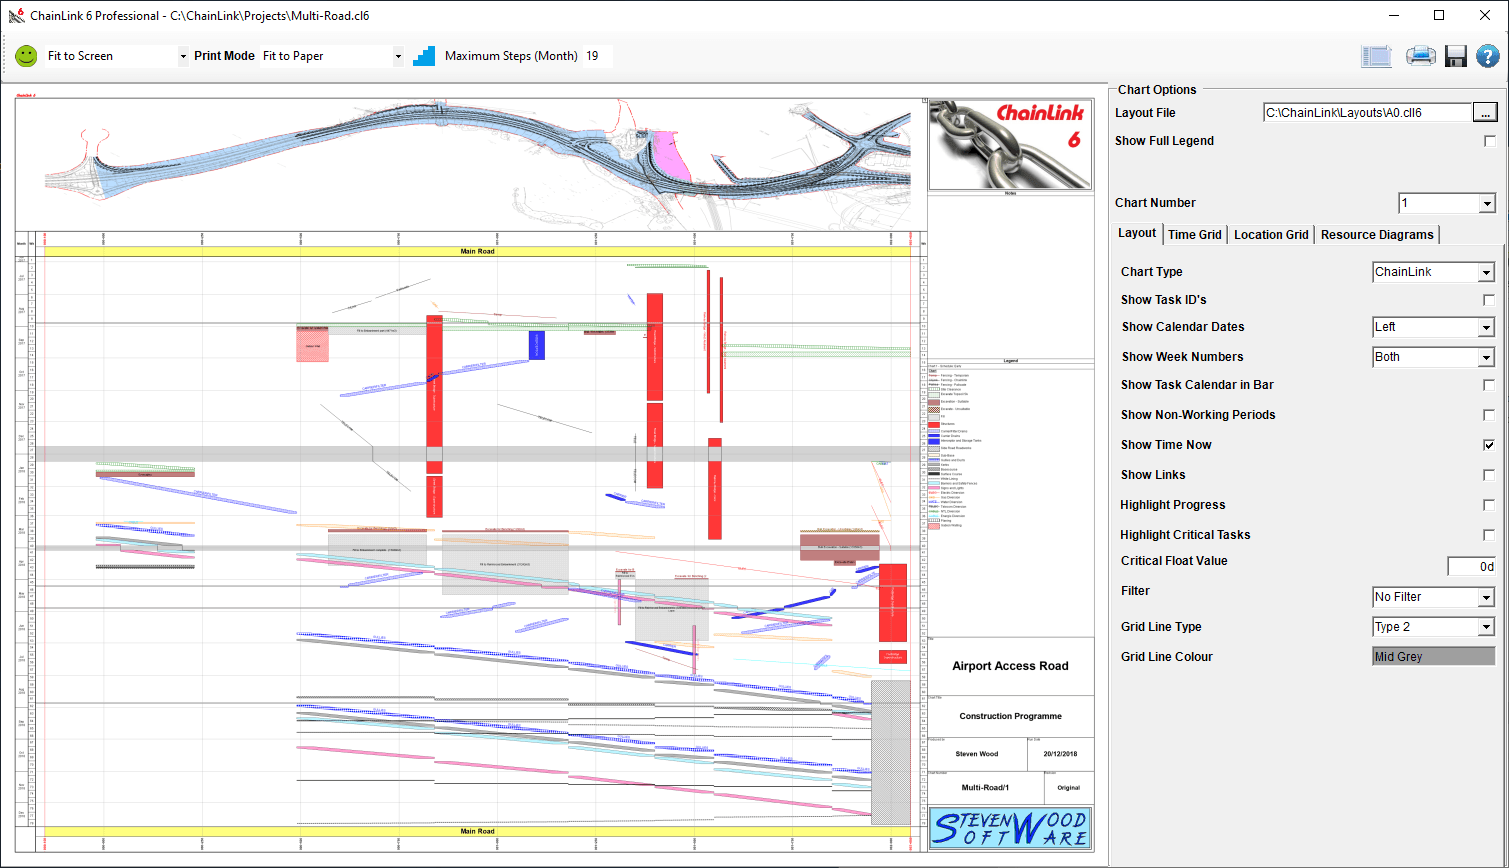
On the Chart Options tabs the Grid Line Type and Grid Line Colour have been moved from the individual chart Location Grid tab to the Layouts tab and now apply to both grids.
On the Location Grid tab the Start and Finish C/L Offset parameters have been added, together with a check box to allow the user to select whether the C/L Offset Window is to be overlaid on the Diagram .
On the Resource Diagrams tab there are now two types of diagrams, Time Axis and Location Axi s (Professional version only).
The Time Axis diagrams are similar to ChainLink 5.0 , however, apart from the existing Single Resource diagrams it is now possible to create a Resource Group of up to ten Resources, selected from the Resources Library, to produce a stacked bar or line graph. On a Single Resource diagram, in order to maintain compatibility with earlier releases, a User Field may be specified as the Resource and the Colour and Hatching set, the latter by using the popup Hatchings dialog.
The Location Axis diagrams have a similar interface to the Time Axis diagrams and can be used to show Quantity/X Location Units (where X is a number optimised by ChainLink ) or Total Quantity as Area or Line graphs.
Chart Diagram
On the Location Grid tab a Show C/L Window on Diagram field has been added to allow the user to select if the C/L Offset grid is to be overlaid on the Diagram. The grid comprises of the maximum and minimum grid lines and the centre line.

If a graphic is being used for the Diagram and a custom C/L Offset window has been specified then the part of the Diagram outside the window is overlaid with a hatched red mask as shown below.
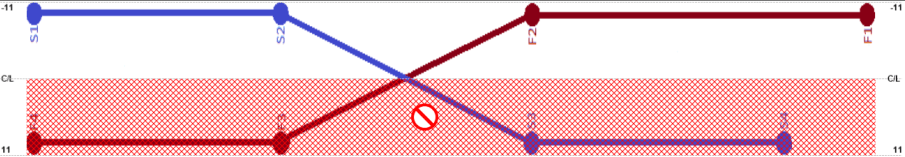
Two further fields are also displayed if C/L Offset data has been entered on the Tasks table.
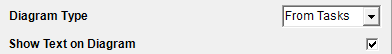
The Diagram Type field allows the user to specify if the Diagram is to be displayed using a Graphic , generated using the Tasks data or a combination of both.
If a Task generated Diagram is being used and a custom C/L Offset window has been specified then only the objects within the specified window are displayed.
The Show Text on Diagram field allows the user to globally override any instruction in the Task data to show the Task Name .