

Gantt Chart (Tasks Tab)
The Tasks on the detailed Gantt Chart of the Dashboard can now be sorted, either by Early Start Dates, by Task ID's or by WBS Codes.
When sorting by WBS Codes a header line showing the WBS Code and Name is added before each group of Tasks.
Selecting the method of sort is set using the View menu.


Gantt Chart (Summaries Tab)
A
Summary Tasks short term programme has been added to the
Gantt Chart of the
Dashboard
showing both
Linked and
WBS Summaries.

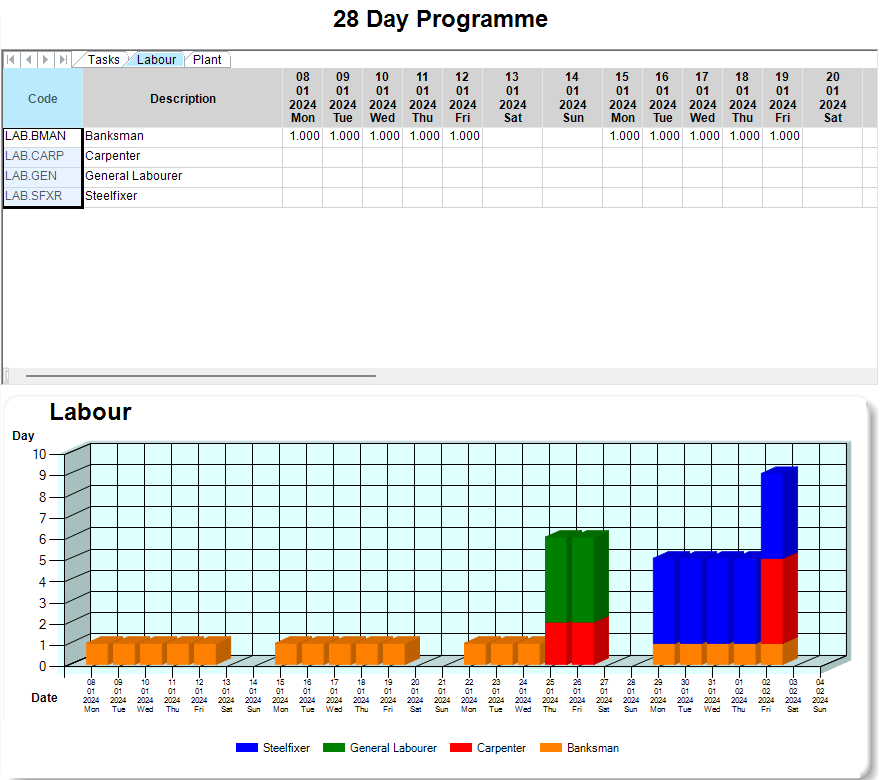
Multiple Resource Histograms
Instead of showing a single Resource on the Histogram, multiple Resources can now be shown by selecting a range of rows on the table or selecting all rows by clicking on the header row. This will display a Stacked Histogram of the selected Resources (see below).
Task Logic
By selecting a Task on the Gantt Chart/Tasks tab, the Start Dangles table, the Finish Dangles table or the Critical Tasks table it is now possible to switch to the Logic Screen for that Task by selecting 'Display Logic' from the popup menu.